COLUMN, ECONOMY

COLUMN: Salem is adding jobs, but unemployment is rising. Why?

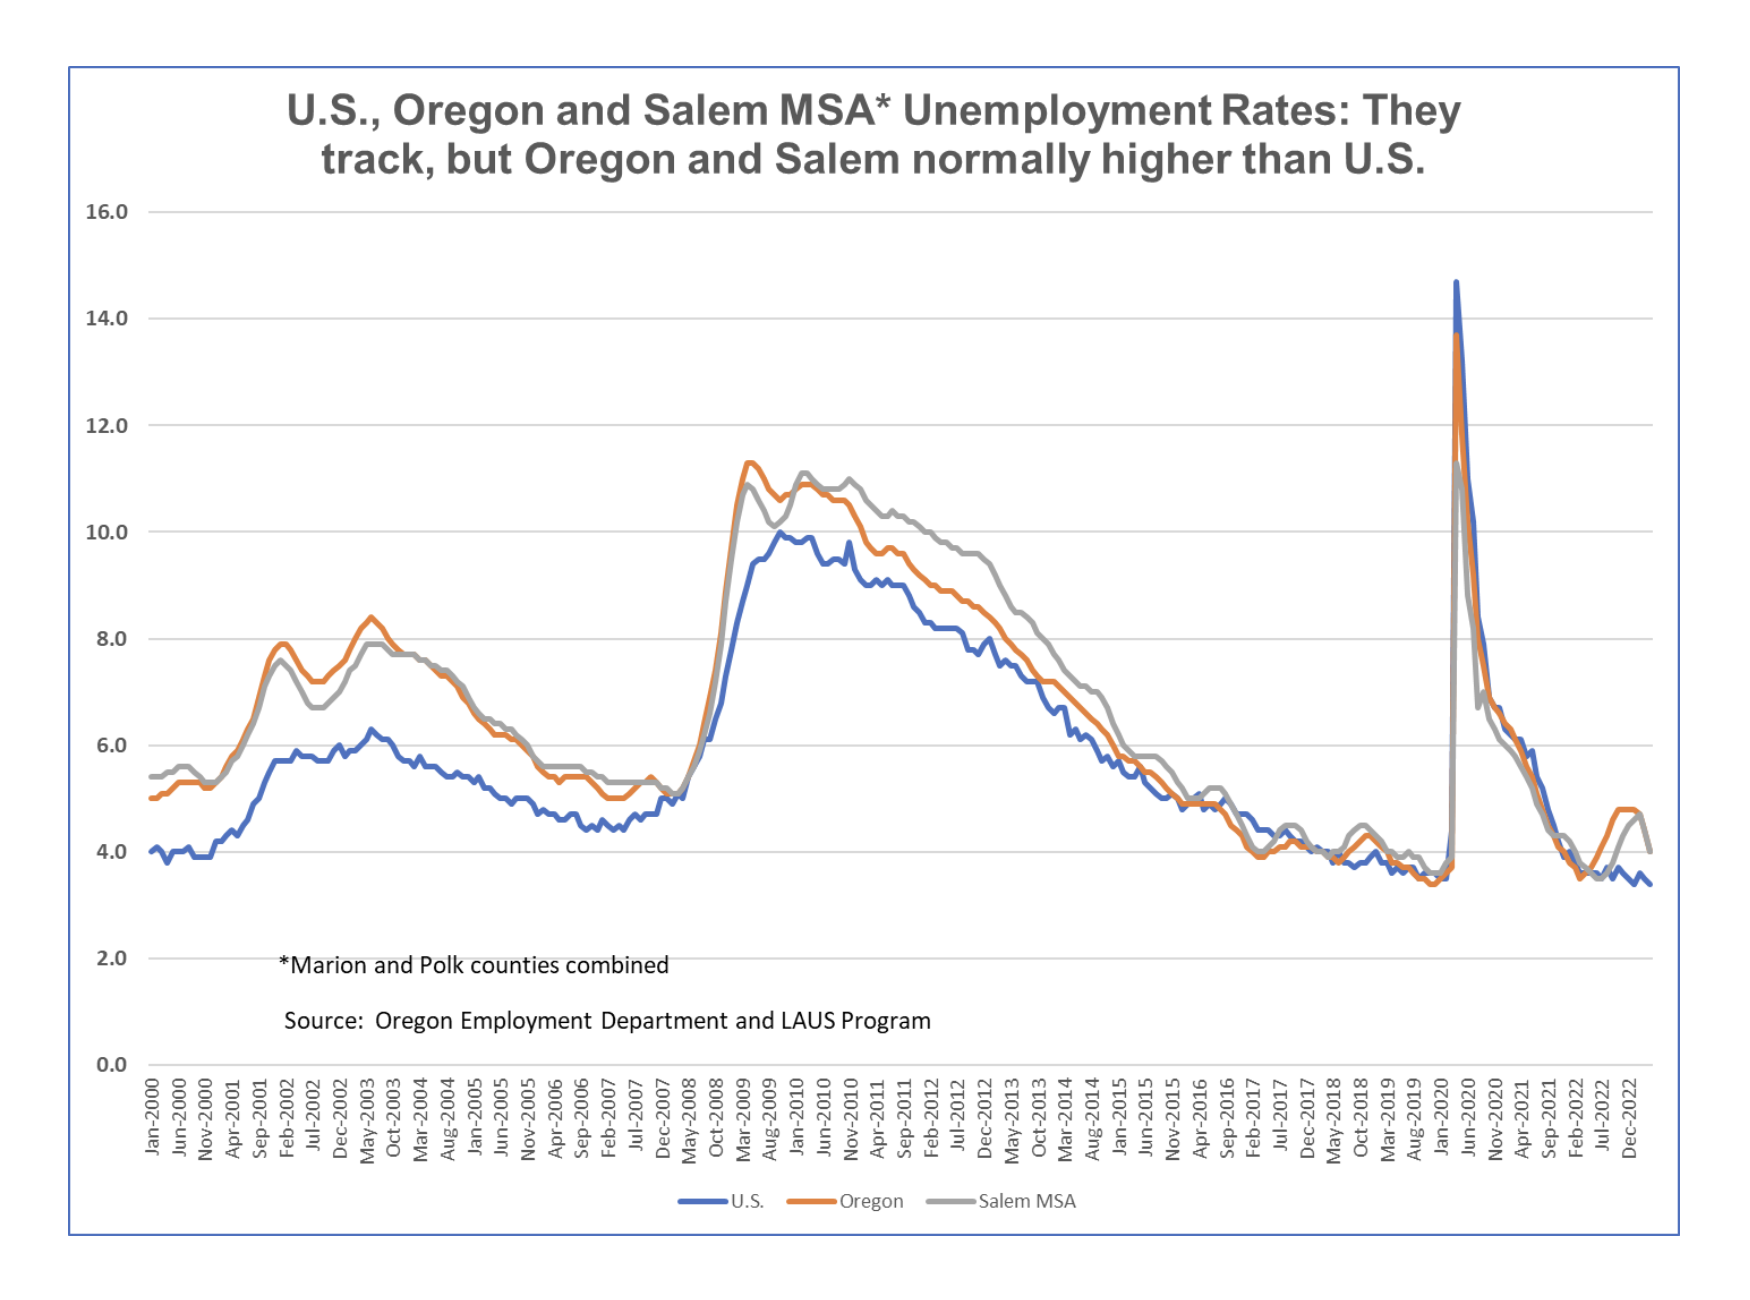
The Salem economy has added jobs consistently over the last seven months, but the unemployment rate crept upward for a number of months during the same period, a contradictory situation. What was going on?

The short answer is that the jobs numbers and the unemployment rate are compiled from two separate surveys, each with a different purpose. 

What this means is that it pays to know a few facts about how the two surveys are done. 

But first, there’s a Salem connection. Approximately 200 Salem establishments participate in the Current Employment Statistics survey. Participating establishments report jobs, hours and payroll to the federal Bureau of Labor Statistics every month to produce a monthly estimate of jobs. They participate in the survey for several years. It is called the “establishment” survey because federal, state and local government employers participate, as well as private businesses.

A small number of Salem area households answer detailed questions about their employment status for the Current Population Survey, which produces the information for calculating the unemployment rate. 

Let’s start with the establishment survey.

It’s important to know that the monthly estimate of jobs for the entire state is from a sample size of 8,300 establishments, which represent the total number of establishments, 187,000. For the Salem area, approximately 200 establishments make up the sample, to represent some 15,000 total establishments.

It is also important to know that there is a database of nearly all Oregon jobs, called the Quarterly Census of Employment and Wages. Every establishment in Oregon with employees covered by unemployment insurance (almost everyone working) reports employee earnings quarterly to the Oregon Employment Department. This is the database for the unemployment insurance program.

But the quarterly census has a drawback. Employer reports take time to compile and the information is usually two quarters behind. The first quarter of 2023 will be published in September.

However, the quarterly census serves as a check against the monthly jobs estimates from the survey.  Employment department economists check their estimates when the census information becomes available and make revisions if needed. 

Now for the unemployment rate, a somewhat different story. Information gathered from household members in the Current Population Survey is used by another federal program, Local Area Unemployment Statistics, to produce the unemployment rate. The number of households participating in the survey is 1,000 for the entire state (out of 1.6 million total Oregon households). The number of Salem area households participating is much smaller. 

Survey interviewers ask household members detailed questions about their employment status, and demographic information, every month for four months, in two consecutive years. 

To be considered unemployed by the survey, an individual needs to be out of work, available for work, and actively looking for work. The labor force is all those working, plus the unemployed. The unemployment rate is defined as the number of persons unemployed, divided by those in the labor force, and expressed as a percentage.

That all sounds neat and tidy, but individuals answering interviewers’ questions isn’t as straightforward as businesses reporting jobs and payroll. During the first month of the pandemic, problems arose in interpreting survey responses. There was confusion about answers to certain questions, such as whether or not a person was expecting to be called back to work, and why they were absent from work. In fact, interviewers were given guidance about how to record certain responses, a first for the survey.

Five pandemic-related questions were added to the survey the next month, and then a separate survey was created, the Household Pulse survey, to capture more detail about how the pandemic affected households and work.

The early months of the pandemic were unusual for the household survey, but the small sample size used to estimate the unemployment rate is always an issue. When a sample size is small, there is a chance that the work experience of individuals in the sample is not representative of the working age population as a whole, in any one month. Therefore, several months of unemployment rates are needed to see a trend.

The bottom line is that, of the two surveys, the establishment survey is the more robust. The sample size is larger, the information reported by establishments is straightforward, and the estimates have the added benefit of being checked periodically against the employment department database of jobs.

Sure enough, over the last few months, the Salem area and Oregon unemployment rates have come down nearly a percentage point, and Salem and Oregon have continued to add jobs. This makes more sense.

An interesting aspect of the Oregon unemployment rate is that Oregon has routinely had a higher unemployment rate than the U.S., sometimes as much as two plus percentage points higher (see graph). Reasons usually given for this are as follows: seasonality of some major industries (construction for example) and in-migration to Oregon which has been extensive over the last decades – some folks come without jobs and are unemployed as they seek work. 

The early part of the pandemic was an exception – the U.S. rate was consistently higher than Oregon’s for a number of months. However, Oregon’s and Salem’s unemployment rates are again now slightly higher than the U.S, the more normal situation.

The moral of the story is: it takes more than one month to see an economic trend, but when in doubt, it’s likely the establishment survey is telling the more accurate story.

There is much more detail available about the survey methods briefly discussed here. Two articles by employment department economist Tracy Morrissette, one recent and one from a year ago, are excellent sources. In addition, the Bureau of Labor Statistics has an overview of the Current Employment Statistics Program and an explanation of how the government measures unemployment

Last but not least, a thanks to those Salem area establishments and households participating in these surveys. Their cooperation is essential to our understanding of the Salem area economy.

Pam Ferrara of the Willamette Workforce Partnership continues a regular column examining local economic issues. She may be contacted at [email protected]

STORY TIP OR IDEA? Send an email to Salem Reporter’s news team: [email protected].

JUST THE FACTS, FOR SALEM – We report on your community with care and depth, fairness and accuracy. Get local news that matters to you. Subscribe to Salem Reporter. Click I want to subscribe!

Pamela Ferrara is a part-time research associate with the Willamette Workforce Partnership, the area’s local workforce board. Ferrara has worked in research at the Oregon Employment Department, earned a Master’s in Labor Economics, and speaks fluent Spanish.